
import numpy as np
import matplotlib.pyplot as plt


def prob(n):
    numerator = np.math.factorial(365) / np.math.factorial(365-n)
    denominator = 365 ** n
    return(1 - numerator/denominator)

probs = list(map(prob, range(100)))

plt.plot(range(len(probs)), probs)
plt.show()We have all been there, classic math riddle:
How many people need to be in one room so that the probability of two of them having the same birthday is more than 0.5?
In a recent bootcamp exercise we tackled this in python and I wanted to share, just because it’s fun. I did it for a range of probabilities. My solution is probably not the fastest/shortest/most pythonic, but it’s a little thing I put out there so, if you want to use/improve it, please do!
A bad translation into R, it would be something like:
prob <- function(n){
  numerator = exp(lfactorial(365) - lfactorial(365-n))
    denominator = 365 ** n
    return(1 - numerator/denominator)
}

probs = sapply(0:99, function(n) prob(n))

plot(0:99, probs, type="l",
     main="Probability of 2 people having same birthday",
     xlab = "People in a room", ylab="probability")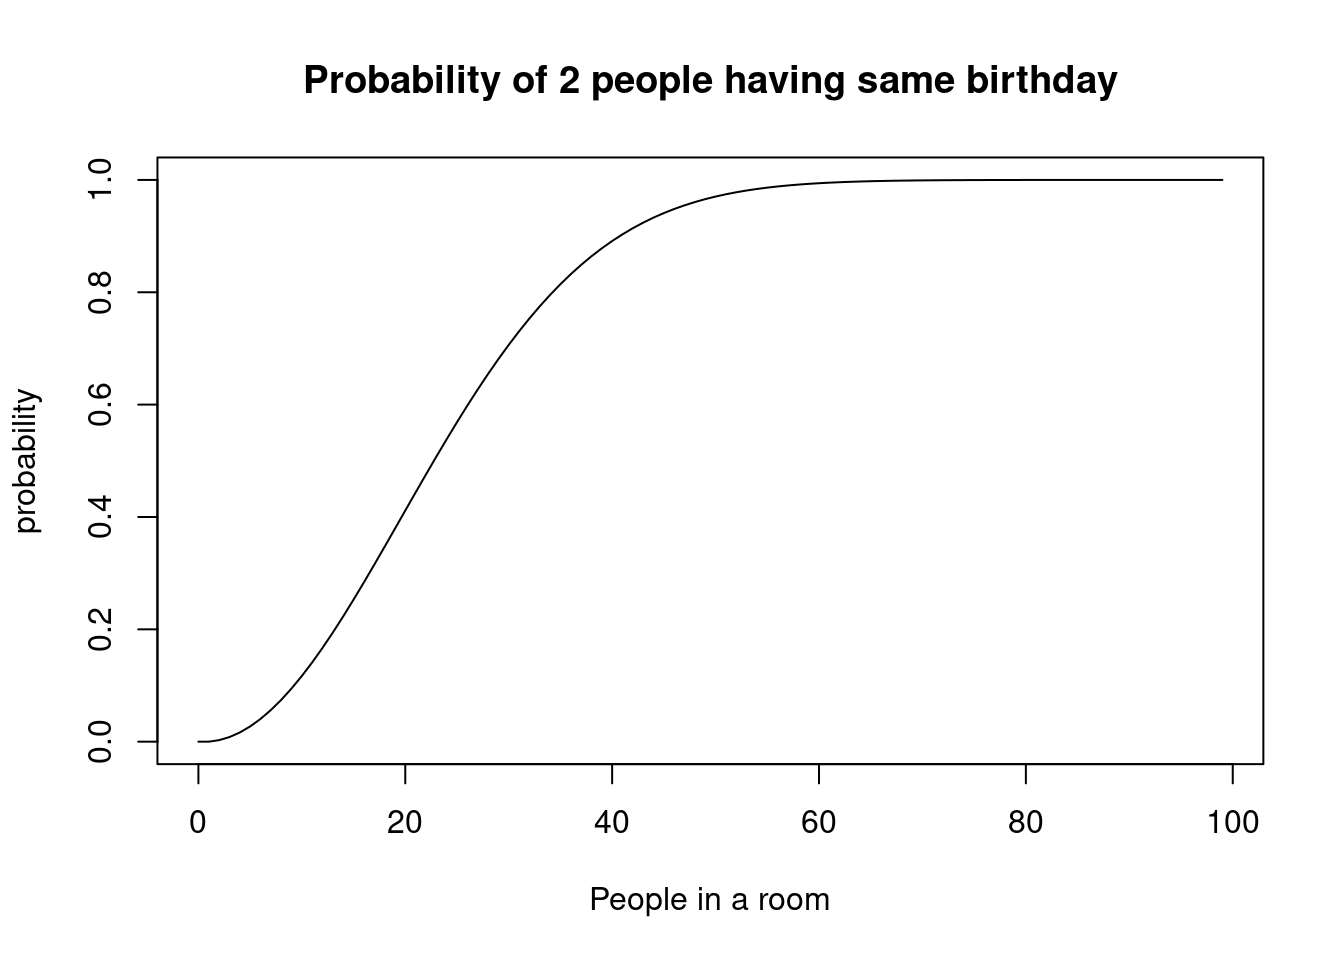
Reuse
Citation
BibTeX citation:
@online{andina2020,
  author = {Andina, Matias},
  title = {Birthday {Problem}},
  date = {2020-06-13},
  url = {https://matiasandina.com/posts/2020-06-13-birthday-problem},
  langid = {en}
}
For attribution, please cite this work as:
Andina, Matias. 2020. “Birthday Problem.” June 13, 2020. https://matiasandina.com/posts/2020-06-13-birthday-problem.